Wednesday, April 30, 2014

More Accurate Temperature Trends

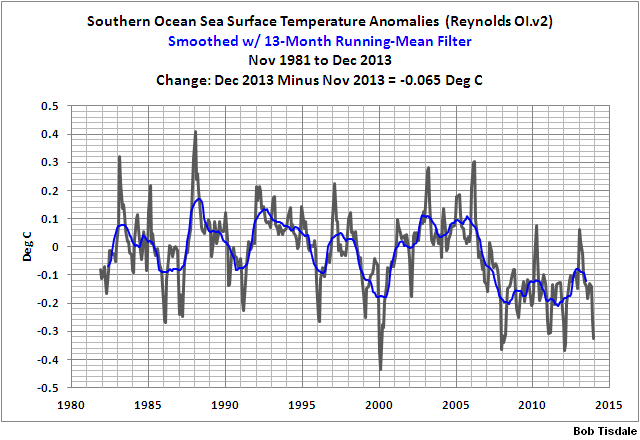
In an article on Cowtan and Way's calculation of global surface temperatures in Science magazine last week, Eli Kintisch gives the chart on the right, and summarizes their findings:
The two most prominent data sets, one maintained by a British collaboration and the other by NASA, have underestimated the pace of warming between 1997 and 2012 by an estimated 158% and 49%, respectively.
He quotes Stefan Rahmstorf:
Correcting the data sets "should have been done ages ago," Rahmstorf adds.
In shortdown, the slowdown in warming is only half as big as previously thought.
"When you fill in the gaps, temperatures in recent years go up, and temperatures around 1998 go down," Cowtan told the climate scientists in Potsdam. The planet has warmed most where scientists are watching least, enhancing the perceived size of the slowdown in warming.
But it doesn't sound like GISS and the Hadley Center are going to implement the kriging scheme for infilling regions with no temperature stations; instead they're going to add more stations:
In Potsdam, Cowtan shared an unpublished result that suggests a data-smoothing algorithm may be tuning down temperature measurements that NOAA's Arctic climate stations supply to NASA. NOAA says it is adding new stations to its network to address the Arctic data gap. Philip Jones of the University of East Anglia in Norwich, U.K., which runs HadCRUT jointly with the U.K. Met Office, says HadCRUT is also seeking to add stations.
I'm a little surprised at that (if true); station coverage is always going to have holes somewhere, and keeping them operating in remote places always is going to be a challenge. Surely Cowtan & Way's algorithm can't be that difficult to implement -- C&W have calculated January and February's anomalies, even though they aren't funded to do that. (In fact, their site says they weren't planning to update temperatures after December 2013.)

Here's a plot of Cowtan & Way's anomalies minus those of HadCRUT4, on an annualized basis:


Tuesday, April 29, 2014

AGU Journals to Become Freely Available(*)

(*) except for the last 24-month's worth of papers, on a rolling basis.

The American Geophysical Union says:
Washington, D.C.— The American Geophysical Union (AGU) and Wiley today announced that, starting 1 May, all AGU journal content from 1997 to content published 24 months ago will be made freely available. This change will apply to all articles and supplementary materials from journals that are not already open access, as well as AGU’s weekly newspaper, Eos. It currently represents more than 80,000 journal articles and issues of Eos.  Additional content will continue to become open every month, on a 24-month rolling cycle.
This includes a lot of good journals, such as GRL, JGR, EOS, and more, and, to the extent that science and rationality still play a part in the debate over climate change, should be useful to everyone.

Tuesday, April 22, 2014

200 Meters Down With a Broken Femur

From the blog of Isaiah Janzen, at the base of Mt Everest, writing on April 21st:
As of 4:30 PM Nepal time Friday, the confirmed death count was 13, with three still missing (missing = really really low chances of survival). Added to that there were several critically wounded and a number of walking wounded. One Sherpa even broke his femur and then still managed to descend 200 meters on his own power. 
(Emphasis mine.) Imagine doing that -- descending 200 meters with a broken femur, after so many of our friends and colleagues have died.

Janzen describes the incident -- which wasn't an avalance in the way we envision it:
I am sure you have heard by now, 16 people died due to a serac falling, with three unrecovered. While we may call it an avalanche, this is about as far from a US powder avalanche that you can get. Think of a ten story building, made of solid ice, that falls over. For those people under it, that's it. 
It easy to say that if you can't haul your own gear up and down the mountain, you can't climbed the mountain. I really don't know -- it is a situation very far from ordinary life.

Janzen concludes:
This mountain is different than any other mountain I have climbed. Normally, I do the climbing, I carry the gear, I set up the tent, I use the stove, I place the gear. Here we have 20 climbing Sherpas and 14 cook staff, plus a team doctor and expedition leader, all for 15 client climbers. I never directly asked for this system, but I paid for it with my checkbook. We had Sherpas just 30 minutes ahead of the serac fall in camp one, they escaped while I had hot chocolate in base camp. Talk about guilt.
Many of the sherpas are striking.

Dave @ Curryblog is Starting to Get It

Global_Coal_Usage.PNGMaybe there is hope for Judith Curry's blog after all.

A guest post by someone named "Dave Rutledge" says:
Without the threat of coal, the IPCC could close up shop and the research program funding would drop to a small fraction of what is spent on research in weather forecasting.
They're finally starting to get it! -- coal is a major part of the global warming problem.

It's not 100% of the problem, by any means -- we will need to reduce emissions in other sectors, like transportation -- and we will probably always need an IPCC-like group of experts to monitor climate and envision the best path forward.

But the sooner we eliminate coal, the better.

The Day When Elephants Murder Poachers

elephant slaughter gabon"Every day," writes io9, "poachers kill 96 elephants in Africa."

Let us hasten to the time when, every day, elephants also kill 96 of the poachers who come to murder them.

Before it's too late..... I mean, it's only fair, right, to also give the elephants powerful guns and fast trucks?

Can someone explain to me why that's not fair?

I'd love to see a few poachers with their jaws yanked far too open, with their dead, bloodshot eyes screaming out in death, while a few elephants yank the gold from the poacher's teeth....

Is that too much to ask for? Really?

Monday, April 21, 2014

Billboards Against Chem Trails

These billboards, going up this week, come from group SKYDER, who describe themselves as "non-profit 501(c)4 dedicated to increasing public awareness about the dangers of unregulated geoengineering, and petitioning lawmakers for change." The group says these billboard are "paid for by philanthropic donations," which might include some crowd funding.


In this video, the group warns against chemtrails, HAARP, DARPA, etc and, in conspiratorial fashion, warn they are causing all kinds of societal harm -- low fertility, Alzheimers, autism, cancer, etc.


Note added 4/22: The title of this post has been changed from "Billboards Against Climate Engineering," which wasn't an accurate characterization of the billboards.

Saturday, April 19, 2014

On Spoofing Judith Curry

It seems Judith Curry isn't at all in defense of the free speech that she claims to be.

She's only in favor of it when it attacks her scientific enemies. When the shoe is on the other foot, she reacts to it with censorship.

Yes, my post earlier tonight was a spoof.

It accused Curry of scientific fraud, for her claim (in Liu & Curry PNAS 2010) that the Southern Ocean has been warming.

Did I really mean that? Of course not.

Though I do have some concerns about that result, since my own calculation of SST trends from 60°S to the south pole from 1/3/1990 to 1/29/2014 find definite cooling (-0.082 C/decade), as did this Bob Tisdale result for the period 1980-2010. (Tisdale's graph is only a hint; I certainly don't consider blog posts of the same caliper as peer-reviewed papers, nor my own simple calculations.)

Curry's period of calculation was 1950-1999. Her paper was submitted and published in 2010, so I don't know why their data analysis stopped as of 1999.

(When I asked Curry about this on Feb 3rd, she replied that "Tisdale's data analysis is usually reliable." My question to her was motivated by this Tisdale comment on Curry's own blog.)

The rest of my comments on Curry's post of today? Total spoofing -- though I certainly have at least just as much evidence as Mark Steyn does about Michael Mann.

Naturally, Curry's syncophants fell for it. However, unlike what I expected, so did she, in just about two hours -- that's how long it took her to turn on comment moderation and start blocking my comments:


That was far easier than I ever expected -- her "defense of free speech" quickly stopped when the shoe was on the other foot.

I don't know if the lesson will get through. But it should.

The Lies of Judith Curry

Update 4/19 9:55 pm - See "On Spoofing Judith Curry"


I have debated within myself whether to reveal and write about this, but after some reflection I feel I have to.

I think Judith Curry lied in a 2010 paper about the temperatures in the Southern Ocean.

I don''t say this lightly. I've looked at the data several times now. I don't know what else to conclude.

Curry published a paper with Liu in 2010:

“Accelerated warming of the Southern Ocean and its impacts on the hydrological cycle and sea ice,” Jiping Liu and Judith A. Curry, PNAS 2010

That paper claims:
"The observed sea surface temperature in the Southern Ocean shows a substantial warming trend for the second half of the 20th century."
Except, it's very easy to download the data and show for yourself that the Southern Ocean SSTs are actually cooling, as Bob Tisdale did here.

You can easily verify this for yourself. The SST data is here. Pick the region from 60 South to 90 South. I did this myself, with the time series starting in 1/3/1990 and ending in 1/29/14, the end date chosen because it was the time I was researching my article.

I found that, over this time period, the Southern Ocean SST changed by -0.082°C/decade, with a statistical uncertainty of only ± 0.001°C/decade (OLS only, no autocorrelation), for a total cooling of -0.19°C over this interval.

So how did Liu and Curry find warming? I really have no idea. It's certainly not a result I trust, and I have some serious concerns that their calculation is fraudulent and that their paper is incorrect, and purposely misleading.

Why? I don't know, at this point. I'm interested in hearing speculations in the comments.

Friday, April 18, 2014

Amazing Picture of the Curiosity Rover on Mars

How's this for a photo - a picture of the Curiosity rover on Mars, taken from the Mars Reconnaissance Orbiter. The rover is the little blue square in the lower left of the picture, just to the right of the rock prominence. Its track comes in from the upper left....

Curiosity and Rover Tracks

By the way, the satellite orbits at a height of over 24,000 km (15,000 miles).

CNet has a little more.

AGW and the Alternative to Government Action

"Like many threats, global warming calls for greater government activity, and that rightly worries people. But in the twenty-first century the alternative to government action is not individual liberty; it is corporate power. And the role of large corporations in this story has mostly been negative, a tale of self-interested obfuscation and short-sighted delay.... the public interest can only be protected by public rules."

-- Spencer Weart, The Discovery of Global Warming: Revised and Expanded Edition (New Histories of Science, Technology, and Medicine)

Thursday, April 17, 2014

VA Court Rules Against Disclosing Michael Mann's Emails

FOR IMMEDIATE RELEASE
from the Union of Concerned Scientists

SCIENCE GROUP WELCOMES VIRGINIA SUPREME COURT RULING PROTECTING SCIENTISTS FROM ONEROUS DOCUMENT REQUESTS

VA HIGH COURT PROTECTS SCIENTISTS' RIGHT TO PRIVACY

WASHINGTON (April 17, 2014) – The Virginia Supreme Court today unanimously upheld a lower court's ruling that would block the American Tradition Institute (ATI) from receiving thousands of private emails from former University of Virginia climate scientist Michael Mann.

The request from ATI, which was made under the state's freedom of information law, directly mirrors one the court also rejected in 2013 from then-state Attorney General Ken Cuccinelli. In recent years, ATI and other groups have targeted researchers at several public universities with demands for wide swaths of private emails.

Michael Halpern, a program manager for the Center for Science and Democracy at the Union of Concerned Scientists (UCS), welcomed the ruling.

"The Court was right to protect scientists' ability to pursue tough research questions free from threats or intimidation," he said. "Freedom of information laws are meant to keep government accountable, not to enable the harassment of scientists.

"The court's decision sends a signal to scientists at public universities that the pursuit of scientific knowledge will be protected in Virginia, no matter how their results might be received. Other Virginia universities and scientists should feel empowered to fight back against these inappropriate requests for private correspondence.

"Other states should examine their own laws to ensure that they balance accountability with privacy, and all public universities should be fully prepared to respond to similar requests."

Specifically, the court found that Mann's business correspondence is a matter of public record but that his personal correspondence, including conversations with other scientists, is "proprietary" under state law and does not need to be disclosed. The court stated that disclosing so many of a researcher's emails would put public universities at a competitive disadvantage against private universities that are not subject to state information laws. They wrote that such a loose interpretation of state law would undermine "faculty expectations of privacy and confidentiality" and impair "free thought and expression."

Halpern has a blog post that examines the case in more detail, including UCS's amicus brief. Michael Mann has also released a statement.

Wednesday, April 16, 2014

The Solar Facility That's Incinerating Birds

Stony Brook physics building
When I was in graduate school at Stony Brook, my office -- about half the size of my living room, but shared with three others -- was on the 2nd floor, called the A level. A-108, I think it was.

It's on the second floor in the picture to the left, just behind the rightmost window.

The department building was nice, because the corridors ran next to the outside windows, with the offices on the inside. There were big plate glass windows with a commanding view of campus, and a convenient wooden bar that ran across them as a barrier, just high enough to lean on and bullshit.

And bullshit we did. During Hurricane Gloria, when we were all standing next to these windows watching the storm, some of these big plate glass windows were blown inward and shattered against the wall behind them. But, fortunately, none we were standing near did that, though the ones near us were flexing inward, a bit like the Tacoma Narrows Bridge.

The eye of Gloria passed right over us. The wind and rain blew like mad for a couple of hours, then it calmed down and we went outside to look around, and a little patch of calm, blue sky passed swiftly right over us. Then the wind started up again but in the opposite direction, and we all went back inside.

Anywaythe big plate-glass windows had problems with birds flying into them, so fake bird silhouettes were painted on the glass, to scare away the birds flying towards it. Sometimes it worked, sometimes it didn't. Sometimes you'd see dead birds on the pavement at the base of the building, and once in a while hear a loud thump, but all in all we were just young people who didn't freak out about a few bird deaths -- we were busy trying to learn physics.

Which finally brings me to this story, "Birds going up in smoke at Ivanpah solar project" in the Mohave desert in California:
A new report from the U.S. Fish and Wildlife Service has labeled BrightSource Energy's Ivanpah project a "mega-trap" for insects and birds that may get singed or in some cases, burned alive flying through the intense solar radiation reflecting off the thousands of mirrors surrounding three solar towers at the plant in eastern San Bernardino County.
It gets specific about the carnage:
"Although not analyzed in detail, there was also significant bat and insect mortality at the Ivanpah site, including monarch butterflies," the report said. "It appears that Ivanpah may act as a 'mega-trap,' (original emphasis) attracting insect-eating birds, which are incapacitated by solar flux injury, thus attracting predators and creating an entire food chain vulnerable to injury and death."

Solar flux is the intense radiation coming off the reflecting mirrors. At Ivanpah, the radiation is so intense it creates what look like small clouds around the boilers at the top of the project's three 459-foot-tall solar towers. These clouds appear to be attracting the insects which in turn attract the birds.
Thre were 141 avian mortalities counted at Ivanpah over a 17-month period, from July 2012 to December 2013. "One third, or 47, were due to solar flux."

Worse, there were very many more birds incinerated wholesale while in flight:
"Ivanpah employees and OLE staff noticed that close to the periphery of the tower and within the reflected solar field area, streams of smoke arise when an object crosses the solar flux fields aimed at the tower. Ivanpah employees use the term 'streamers' to characterize this occurrence.
The article claims that one streamer was seen "about every two minutes." That seems like just a guess, quite incongruous with the number reported above, but assuming it's true, at 12 daylight hours a day, that'd be 373,000 more dead birds in the 17-month period, or 263,000 per year.

That's a lot of birds. Just at one site (albeit one big site).

I've gone camping and tramping around in the Mohave, and I don't know if there were that many birds flying around. Maybe -- I don't recall. Perhaps they're attracted to the activity at the facility, and the feeding possibilities from all the dead things.

Now (I don't want to use the word "but" here, which sounds like an excuse), I found these numbers from the Fish and Wildlife Service:
Estimates of annual bird deaths, by the U.S. Fish & Wildlife Service (2002):

Building window strikes: 97-976 million per year
Communication towers: 4-5 million per year
Transmission lines: up to 174 million per year
Cars: up to 60 million per year
Pesticide poisoning: about 72 million per year
Oil and wastewater pits: up to 2 million per year
Cats: hundreds of millions per year
Are they accurate? I don't know. It's a lot of birds sacrificed on the alter of human development.

My cat Oliver just killed a bird the other day and brought it into the house, and he's killed at least two more in his four years. But one of those was when the bird flew in through the open back door and crashed into an opposite, closed window on his way back out. Is that my fault?

I killed a bird a few months ago driving up to Portland -- it flew right into my car. Or, from it's perspective, my car ran right into his flight plans.

Albert Schweitzer
I read once that Albert Schweitzer, when he was working in Africa, would write at night in his cabin, but for fear of moths immolating themselves on his candle, would keep his windows closed and sit there sweating while he wrote.

I'm well aware that climate deniers and enemies of renewable energy don't really care about birds, but will (and are) using these bird deaths for political purposes. That's very low, but we are a low species, when you get right down to it.

So should Stony Brook have had a different physics building, all brick with no windows and everyone walking to work? Is it better to kill birds with solar rays than by destroying their habitat for development or altering their ecosystems through climate change? Was Albert Schweitzer a little bit out there?

I do not know. Unlike when I was young, I now whince when I kill the tiny ants I occasionally find near my kitchen sink. Is that a fake whince, a little show I put on just to console myself? I still kill them with a swipe of a sponge, and 15 seconds later have mostly forgotten (until now). If a bug is big enough I try to capture it in a container and let it loose outside. Do I do that for me, or for it?

I don't hunt but I eat meat. I've tried being a vegetarian and found it difficult after a few months; I give in to my urgings and weakness. I can't even read the occasional posts Andrew Sullivan puts up about the cruelty on the innumerable cows, pigs and chickens in our animal-industrial complex, or watch the YouTube videos made secretly by animal rights activists. I feel like shit just for saying that, even as I have a piece of chicken cooking in the oven.

I give my two cats every bit of pleasure I can, until they prance in the back door with a dead bird between their jaws, proud and happy as anything. I run around like a maniac chasing them back outside, yelling at them the entire time, chasing the storm away until it's blue skies again. I just had the carpet cleaned, and I don't want it stained with feathers and blood.

So Oliver -- and it's Oliver who causes all the trouble around here -- dashes back outside with the bird still between his jaws, where he lays it in the grass and looms over it 'til it dies. He clearly doesn't think twice about what he's doing, and I know he is just being a cat.

Eastern US, Canada the One Cold Spot on the Warm Global Map

NOAA has put up its temperature data for the continental US for March: 40.51°F. (Yes, °F and not °C. Sigh.)

That's cold -- 0.99°F below the 1901-2000 mean, and a frigid 2.49°F below the 1980-2010 mean.

It's the 4th-coldest January-March since their record started in 1895. (The meteorological winter, Dec-Feb, was only the 47th-coldest, though.)

But eastern North America is the only noticeable cold spot on the global map for March, from GISS:


So keep that in mind when people say it's been extremely cold in Witches Teat, Wisconsin and the Great Lakes won't thaw out until Labor Day. In Siberia they're already fighting forest fires. In April. In Siberia.

Here is Oregon it was the 17th-warmest March, and 12th-wettest.

Tuesday, April 15, 2014

An Age-Old Argument

The Daily Goulash

A definite read: Kerry Emanuel on low-probability "tail risk" climate change impacts, at the Yale Forum

Ken Caldiera was on KQED today talking about geoengineering, and three of the call-in questions were about chemtrails.... (Click here if you haven't heard about this particular bit of lunacy from the conspiracy theorists.)

Oh, yeah, now there are Hillary shoethrowing truthers, too. 

Let's just call this the age of the "truth truthers."

This is good: an article in Business Insider about Google's advanced projects, one of which was a space elevator, says Google abandoned it because "the team did find one material that could work, carbon nanotubes, but no one has successfully made a perfectly formed carbon nanotube strand longer than a meter." Duh, space elevator enthusiasts have known this since, almost literally, the day carbon nanotubes were discovered in the early 1990s....

All that Asian pollution may be making Pacific storms stronger. Haiyan?

"...roughly 1,550 volcanoes that have erupted in the recent geologic past."

The Milwaukee Journal Sentinel has endorsed a revenue-neutral carbon tax: "Reducing emissions, especially from power plants and vehicles, remains a priority. Technology can help with that, but probably the best way to push that technology is to impose a revenue-neutral carbon tax. Such a tax would encourage the fossil fuel industry to search for other ways to provide energy; the money could be used to reduce the deficit or as rebates to taxpayers."

Here is a mnemonic for the decimal expansion of Ļ€, where the number of letters in each word is the digit: "How I want a drink, alcoholic of course, after the heavy lectures involving quantum mechanics. All of thy geometry, Herr Planck, is fairly hard...:" [3.14159265358979323846264...]

Did you know the Bible says Ļ€ = 3? Here is I Kings 7:23 (King James Version): "And he made a molten sea, ten cubits from the one brim to the other: it was round all about, and his height was five cubits: and a line of thirty cubits did compass it round about." (Ļ€ = circumference/diameter = 30 cu/10 cu = 3.)

In junior high school we were taught to use 22/7 for Ļ€, and it wasn't until 10th grade trigonometry that I realized that was just an approximation, and not until I was a freshman in college until I realized it can't be expressed as a fraction in any case. Duh.

Monday, April 14, 2014

Wheat's Nutritive Value Decreases Under Elevated CO2

Amber waves of less nutritious grain
Lately you hear a lot of, well, trash talk about how CO2 is good for plants and CO2 fertilization will be a boon for agriculture, and all that. (If you can't deny climate change, then you argue it will be beneficial.) In reality the changes to plants under climate change are complicated, with higher CO2, higher temperatures and changes in precipitation comingling in complex ways.

Plant tissues also change, and this recent paper in Nature Climate Change is very interesting:

“Nitrate assimilation is inhibited by elevated CO2 in field-grown wheat,” Arnold J. Bloom et al, Nature Climate Change, April 6 2014.

This paper presents a direct test of the hypothesis, pointed to by meta-analyses, that more CO2 inhibits nitrogen assimilation into proteins. Higher CO2 increases yields, but protein concentrations decrease. Who wins?

In a trial of field-grown wheat in Arizona, under conditions of elevated CO2 (up to 559 ppmv), this research group found that nitrate assimilation was indeed slower under elevated than ambient CO2. The authors conclude
These findings imply that food quality will suffer under the CO2 levels anticipated during this century unless more sophisticated approaches to nitrogen fertilization are employed.
The Times of India quotes the lead author, Arnold Bloom of UC Davis:
"Food quality is declining under the rising levels of atmospheric carbon dioxide that we are experiencing," said lead author Arnold Bloom, a professor in the department of plant sciences at University of California, Davis.

"Several explanations for this decline have been put forward, but this is the first study to demonstrate that elevated carbon dioxide inhibits the conversion of nitrate into protein in a field-grown crop," he said.
The article says that wheat "provides nearly one-fourth of all protein in the global human diet." It concludes:
Bloom noted that other studies also have shown that protein concentrations in the grain of wheat, rice and barley — as well as in potato tubers — decline, on average, by approximately 8 per cent under elevated levels of atmospheric carbon dioxide.

"When this decline is factored into the respective portion of dietary protein that humans derive from these various crops, it becomes clear that the overall amount of protein available for human consumption may drop by about 3 per cent as atmospheric carbon dioxide reaches the levels anticipated to occur during the next few decades," Bloom said.
That is, 3% is the difference between the increase from CO2 fertilization and the decrease in protein density.

Of course it's possible that scientists and farmers will find better methods of nitrogen fertilization to overcome this decrease. And now it's starting to look necessary....

The Langley, A Useful But Forgotten Unit

I like to collect units (like the Sverdrup), and came across an interesting one today -- the langley (ly), which is a unit of energy per unit area. Climate scientists back in the '60s used to use it for solar irradiance, and here's why -- it makes it easy to express the solar energy incident on the Earth.

The langley's definition is

1 ly = 1 calorie/cm2
where, as usual

1 calorie (cal) = the amount of heat required to raise one gram of water by 1 degree Celsius.

If you convert this to SI units, you get
1 ly = 41,840 Joule/m2
so
1 langley per minute = 1 ly/min = 697.3 Watts/m2

so the Earth's solar constant is
S = 1365 W/m2 = 1.96 ly/min ≈ 2 ly/min

which is a nice small, round number.

Going further, the "dietary calorie" -- how we measure the energy content of food -- is the Calorie (= 1000 cal). So

≈ 20 Cal/min per square meter

Now, 20 Cal is the energy content of a lime (or 5 spears of asparagus, or 3/4ths of a cup of green beans, or 1/2 of a medium summer squash), so

≈ 1 lime per minute per square meter


which is an interesting way to think about the solar constant (which isn't really a constant, but the name sticks.) If the average person eats 2,000 Calories per day (call it one "eat"), then, if I did the conversions right

S ≈ 10,000 eats/min per square kilometer

But the average person lives about 20,000 days (hence the Moody Blues song), so the amount of food they will eat in one "lifetime" is about 20,000 eats. So

S ≈ 0.5 lifetimes/min per square kilometer

So a couple eating about average, and living about the average number of years, will together eat about as much food as the energy the sun delivers to a square kilometer in one minute.

At the top of the atmosphere, of course. The amount at the surface will depend on their culinary albedo.

When Data Doesn't Fit

Here's an interesting thought from Spencer Weart's book.... He's writing about those who claim connections between sunspots and climate. Emphasis mine:
"Some found the connections plausible, but to most scientists the speculation sounded just like one more of the countless sunspot correlations that had been announced only to be rejected sooner or later. Even if the evidence had been stronger, it would have met with deep skepticism, for scientists cannot well fit data into their thinking unless theory meanwhile prepares a place."
It reminded me of this slide from somebody's symposium:


Sunday, April 13, 2014

"Gaaaaah!"

"And finally, please please just stop saying it is the responsibility of ‘environmentalists’ to come up with tactics to persuade the rest of us, who by implication are perfectly entitled to sit back and not take our responsibilities on this issue seriously unless and until ‘environmentalists’ come up with arguments that are appealing to us in every way. Gaaaaah!"

-- Tom Toles, "Environmentalists Doing It Wrong, Again," Washington Post 4/10/13

Mental Biology

In the mail: Mental Biology: The New Science of How the Brain and Mind Relate by W.R. Klemm, published by Prometheus Books.

I'm especially looking forward to reading Chapter 3 - The Nature of Consciousness. I'm currently reading The Singularity is Near by Ray Kurzweil, and not at all convinced (at least, yet) that building a machine with the computing power of the human brain (~1015 operations per second) will give a machine with the capabilities of the human brain. Or that any machine ever will. But I don't really know why I suspect this. Maybe Klemm's book will help.

The Coming El Nino and Surface Temperatures

So if the coming (probably) El Nino peaks with a Nino3.4 sea surface temperature anomaly of about 0.8-1.0°C, as NOAA's models are currently projecting (on average), what might that mean for the peak in surface temperature?

Recent history doens't offer much help. Below are the peak surface temperature anomalies (Cowtan & Way dataset) plotted as a function of peak Nino3.4 SSTAs I plotted yesterday.


There's no correlation. Some recent El Ninos have caused even warmer surface temperatures than did the monster 1997-98 El Nino, even though the surface water in the equatorial Pacific never got as warm.

But some did not.

And of those that did, both (2007 and 2010), the latter happened despite the Pacific ocean being in the negative (cold) phase of the PDO.

So the current cold phase might not matter, as some have speculated.

But there is somewhat of a correlation between peak UAH lower tropospheric temperatures as a function of  peak Nino3.4 temperatures:


which is a little surprising, but the correlation between surface temperatures and lower tropospheric temperatures is not perfect (especially, it seems, after El Ninos):


(The correlation is only slightly better (R2 = 0.72) for a 1-month lag, and it degrades with higher lags after that.)

So again, it look iffy to guess what the coming El Nino might bring to atmospheric warming.

Saturday, April 12, 2014

How Might The Coming El NiƱo Compare to 1997-98?

NOAA's Climate Prediction Center's latest ENSO advisory has a more than 50% chance of an El NiƱo developing by summer:
Synopsis: While ENSO-neutral is favored for Northern Hemisphere spring, the chances of El NiƱo increase during the remainder of the year, exceeding 50% by summer.
with "the oceanic heat content to the largest March value in the historical record back to 1979" [graph].

How might it compare to the monster El NiƱo of 1997-98?

I took the CPC's "plume" of model predictions for the upcoming Nino3.4 sea surface temperature anomalies, and added the same region's SSTAs from the Big One. (NiƱo3.4 is a particular region in the equatorial Pacific ocean where heat values have historically been useful in classifying ENSOs.)

In the figure to the right, the solid green line above the others is the 1997-98 El NiƱo, plotted from March 1997 to December 1997. December saw the peak of that El NiƱo, with a NiƱo3.4 SSTA of 2.8°C.

The Big El NiƱo of 97-98 was significantly larger than the current predictions for the predicted El NiƱo, with SST anomalies over twice as large.

Of course there's a lot of uncertaintly; NOAA says their models aren't so good this far away:
Despite this greater model consensus, there remains considerable uncertainty as to when El NiƱo will develop and how strong it may become. This uncertainty is amplified by the inherently lower forecast skill of the models for forecasts made in the spring.
Will definitely be fun to watch. Roy Spencer says after past El NiƱos, peak tropospheric warmth occurs about 2 to 4 months into the next year.

Friday, April 11, 2014

Journalists Cheer Glenn Greenwald's Arrival in US

How often does this happen? -- From the NY Times:


Here's hoping Glenn Greenwald (at least) wins a Pulitzer Prize when they're announced on Monday. It's hard for me to imagine anyone more deserving -- and that the Pulitzers have more to lose if they don't give him one.

Correction and Clarification Regarding Anthony Watts

Anthony Watts tells me I made a mistake in my post about him and his financing the other day.

He says the $44,000 was for not for blogging, but for one-half of this web site: http://climatereferencenetwork.org/

The other half, he says, never came, because "the donor bailed after Gleick’s crime of impersonation and the subsequent hullabaloo."

GISS: 4th-warmest March

GISS found March to be the 4th-warmest March in their records, with an anomaly of +0.70°C, and the 25-warmest month overall, out of 1,611 months (134.25 years) since 1850.

Their 30-year trend remains at 0.17°C/decade, and their 15-year trend at 0.09°C/decade.

In the Northern Hemisphere is was the 3rd-warmest March, and 8th-warmest month since 1850, at +1.09°C. Yes, the Northern Hemisphere is seeing anomalies above +1°C. (The first occurred only in 1995.)

The Southern Hemisphere was only the 20-warmest March, at +0.30°C, and the 266th-warmest month there, again out of 1,611 months.

Maybe someday we will all end up moving to the Southern Hemisphere to escape climate change. At present the Northern Hemisphere has 3.9 times the population density of the Southern Hemisphere.

John von Neumann on CO2, From 1955

"The carbon dioxide released into the atmosphere by industry's burning of coal and oil--more than half of it during the last generation--may have changed the atmosphere's composition sufficiently to account for a general warming of the world by about one degree Fahrenheit."

-- John von Neumann, "Can we survive technology?" Forbes, June 1955.
Here's a compilation of many more early papers and articles on CO2 and climate that I've been gathering....

Tuesday, April 08, 2014

Anthony Watts Admits to Taking the Money


Update 4/11: Correction and clarification.

Maybe this is old news to everyone else, but it isn't to me: Anthony Watts just recently admitted to taking money from a Heartland Institute-ish donor.

You'll notice he can't come clean and say who funded him.

Or by how much.

{Aside: isn't it hilarious that Watts thinks people want him in jail? That ego knows no bounds....}

This, as far as I know, is the first major admission by Watts since he told me a year and a half ago that he got $44,000 in January 2012, from an "independent donor."

Perhaps it's the same donation he's referring to here.

Since he's not up-front about his funding sources, like scientists are, we really don't know.

In any case, $44K is quite a large sum just to blog. I guess it never occurred to him to blog out of conviction.

Patrick Moore Admits What He Left Out of His Congressional Testimony

I asked Patrick Moore, in email (identifying myself as a journalist), why he left out of his Congressional testimony the fact that the Sun's intensity is increasing by about 1% every 110 million years -- and so was about 4% lower 450 million years ago. His response:
If you had 5 minutes in the Senate I’m sure you would leave a few things out too.
Of course, that's a very major thing to leave out of the story. It's a HUGELY important fact to leave out of the story -- the most important thing, by far.....

Yet Moore left it out.

That's what he told me. Though his email was pretty confused, as you might expect:


Or, at least, it sure seems confusing to me.

Frankly, I don't believe Patrick Moore knew that the Sun was much weaker in the past. I think he had his (false and incomplete) CO2 story, and was going to go with it no matter what, not because he knew there was more to the story, but because he didn't, and was mostly ignorance of a deep understanding of deep time.

By the way, some scientists think that the dawn of the age of plants sucked enough CO2 out of the Earth's atmosphere to help cause the Ordovician–Silurian ice age. But Patrick Moore finds that too complicated to think about, I'm sure -- let alone mention to the U.S. Congress.

Over 70% Chance of an El Nino, Says Oz Bureau of Meteorology

Today's ENSO Wrap-up by the Australian Bureau of Meteorology estimates a greater than 70% chance an El Nino will develop this summer (Northern hemisphere summer; their winter), although they say it's too early to estimate its strength.

Some people are already trying to spin away the impact of this coming El Nino; Roy Spencer wrote:
Of course, an El Nino at the end of the record will increase the global temperature trend…at least temporarily…but El Nino is often followed by a cool La Nina, which would basically cancel out that effect.
UAH_LT_1979_thru_March_2014_v5Of course, a El Nino La Nina at the end of the record will increase decrease the global temperature trend…at least temporarily…but El Nino La Nina is often followed by a cool warm La Nina El Nino, which would basically cancel out that effect.

Though the world never did cool much after the 1997-98 El Nino, did it?

Notice how Spencer labels his graph with "El Nino Warming," but doesn't label the "La Nina Coolings." No bias there.

Monday, April 07, 2014

UAH (but not RSS) Again At Record (5yr) High

Both UAH and RSS have put up their temperature anomalies for the lower troposphere for March. For UAH the last 5 years are again at a record high, but the difference between them is growing:


(MA = moving average.) I've adjusted for baseline differences, so both sets of anomalies are relative to the UAH baseline of January 1981 - December 2010.

Sunday, April 06, 2014

The NY Times Lets Some Bad Science Slip Through

One thing I noticed about the NY Times' response to the response to their coverage of the IPCC WG2 is that they didn't include any deniers or scoffers this time, either in the letters to the editor or in an online debate among experts.... There simply was no one from the Cato Institute or AEI invited in.

Perhaps they've gone the way of the LA Times, and finally accept that scoffers have nothing to say of scientific consequence.

These are small but important victories for the science.

However, they did let one piece of bad science slip through. In a letter to the editor, Bela Liptak wrote


In fact, it takes very little of the planet's energy imbalance of about 0.5-1 W/m2 to melt ice. That's the reasoning behind the statements that delineate where the extra heat is going; for melting ice it's only about 2.1% of it.

To make that explicit, I looked up the rates of ice melt for the Arctic, Greenland, Antarctic, and for land-based glaciers. I found


where the data source are PIOMAS, Shepard et al Science 2012, and Gardner et al Science 2013. Gt = gigatonnes.

The density of ice at 0°C is 916.7 kg/m3, though a little less (870) for sea ice. But using the former number for all (this is only a blog post, not rigorous science), and the heat of fusion for ice of 334 kilojoules per kilogram, I find that it now takes 2.5e20 Joules per year to melt the Earth's ice, or 0.02 W/m2 over the Earth's entire surface.

That's very small compared to our current planetary energy imbalance of about 0.5 to 1 W/m2, and so there will be little difference in global warming once all the ice is gone, unlike the effect claimed by the NYT letter writer. (Update 4/16: Of course, the ice-albedo feedback will be quite different, but that's a different phenomenon.)

I'm a little surprised one of their science editors or science writers let this letter get through.

Steyn Can't Even Be Honest About the Little Things

Mark Steyn wrote today:
The IPCC's latest report landed this week to a very muted response.
The man is outright delusional.

Or, more likely, so used to bending the narrative via Islamophobia he thinks it will work with climate science.

The IPCC 5AR WG2 report was, of course, reported on by essentially everyone, and editorialized on by the New York Times, the Washington Post, the Los Angeles Times, Newsweek, the Wall Street Journal.... and then I got tired of looking.

If Steyn can't even be honest about a basic little thing like the response to a widely discussed report, how can anyone believe him on anything else?

About Great Scientific Papers

"Every great scientific paper is written at the outside edge of what can be known, and deserves to be remembered if there is a nugget of value amid the inevitable confusion."

-- Spencer Weart, The Discovery of Global Warming: Revised and Expanded Edition (New Histories of Science, Technology, and Medicine)
This is a very good book that I'm reading now for the third time. Every time I understand the science history better, and develop a better understanding of the people who built a solid case for GW, climate models, and AGW.

It doesn't spend a lot of time talking about the evidence for manmade global warming, but it definitely gives you an understanding of how it came about, who was important and why, and for the order of how the evidence unfolded.... It's only 200 pages, and a good suggestion for anyone who wants to learn more about the idea of manmade global warming, which has far deeper roots than most contrarians are willing to admit.

It's the kind of book a Steyniac ought to read -- or Mark Steyn himself -- but surely won't. Careful, or he might learn something.

“If people are persuaded by evidence...."

From The Hill, about the IPCC 5AR WG2 report:
“I would have been shocked if this would have caused anybody to change what they thought,” said Andy Dessler, a professor of atmospheric science at Texas A&M University. “If people are persuaded by evidence, they would have been persuaded long ago.”

Friday, April 04, 2014

Eastern US Sea-Level Rise, Modelling vs. Observations

Someone asked about how sea-level projections for the eastern U.S. seaboard compare to observations.

It's only been a few years since the hotspot was detected, but here's how modeled results compare to observations for the period 1992-2002, from Yin et al, Nat Geo (2009):


On the left are the observations, on the right is a simulation using the GFDL CM2.1 model. The authors write
The simulated dynamic SSH [sea surface height] during the 1990s is realistic compared to the observation, especially in terms of the sharp SSH gradient across the narrow Gulf Stream and North Atlantic Current.
Then their projections using this model are, for New York City and Washington DC:


where they have considered two different contributions to sea-level rise: the "steric" changes due to thermal expansion and salinity variations of seawater, and "dynamic" changes to the adjustment of the sea surface in response to changes in the AMOC (Atlantic Meridional Ocean Current).

So the line you probably want to focus on is the solid red line, which is both contributions for the A1B scenario. Sea-level projections along the east coast are about another 50 cm higher by 2100. (It will probably continue to rise after that, of course.)

North Carolina, Gluttons for Punishment

Eli has an interesting post about the troubles North Carolina is having with sea level rise. The eastern U.S.  seaboard is a hotspot for sea level rise, and it seems there is a little problem with houses falling into the ocean. Eli quotes the Nags Head Town Manager Cliff Ogburn asking for guidance:
"Pick the number. ... We're just waiting for somebody to decide an accurate projection," he added. "I wish people 40 years ago would have imagined that we'd have houses falling into the ocean."
Of course, people 40 years ago did warn about sea level rise, like in this 1977 report by the National Academy of Sciences, Energy and Climate, which says (pg 8):

from a 1977 NAS report on climate change


Few listened.

The report couldn't have been more clear (pg 11):


Nobody listened. And this is from the National Academy of Sciences. Yet nobody listened. And still they won't listen.

We will pay for climate change one way or the other. We can pay to build a low-carbon economy, or we can pay for houses that wash out into the sea.

P.S. Eli also quotes a vice president of an economic development group saying
"There's been no signal of CO2 increase with any signal of temperature increase or sea-level rise," said Larry Baldwin, NC-20's vice president of regulatory affairs, who is also one of the four holdover members of the CRC.

"We need to hear not just one side of the facts, we need all of the facts," Baldwin added. "One of the things we'll hopefully be able to do is get people with the minority opinion on there."
Who knew facts have two sides?

Thursday, April 03, 2014

Monckton + Hypocrisy = 2*Monckton


Sources:
first quote
second quote

The Exact Value of Climate Sensitivity Doesn't Much Matter

This is a really important point in Michael Mann's Scientific American article:
To my wonder, I found that for an ECS [equilibrium climate sensitivity] of three degrees C, our planet would cross the dangerous warming threshold of two degrees C in 2036, only 22 years from now. When I considered the lower ECS value of 2.5 degrees C, the world would cross the threshold in 2046, just 10 years later....

So even if we accept a lower ECS value, it hardly signals the end of global warming or even a pause. Instead it simply buys us a little bit of time—potentially valuable time—to prevent our planet from crossing the threshold.
It's easy to get fooled by not taking the exponential view (of emissions); our guesses usually take the linear view of things, and we end up failing to properly foresee the future.

With exponential emissions, the exact value of ECS doens't matter much. Of course, it matters whether it's 2 C or 4 C, but what's after the decimal point isn't crucial.

The Buoyant Airborne Turbine

From Altaeros Energies:


Intended for niche markets, like rural areas and disaster zones. I don't know what it's maximum output is [Update 4/4: Altaeros tells me it's 30 kilowatts for their Alaska project], but the NY Times says it can power about a dozen homes at about 18 cents per kilowatt-hour.

I suppose in-town this would interfere with all the drones that will be delivering Amazon packages and assorted baked goods, but even in rural areas it might still have to contend with the Facebook drones and Google balloons. And someday space elevators. The 21st century is looking crowded already.

--
Aside: This is interesting, from the NY Times article:
With new technology allowing developers to build taller machines spinning longer blades, the industry has been able to produce more power at lower cost by capturing the faster winds that blow at higher elevations. This has opened up new territories, in places like Michigan, Ohio and Indiana, where the price of power from turbines built 300 feet to 400 feet above the ground can now compete with conventional sources like coal.

Wednesday, April 02, 2014

Nordhaus on Ignoring Evidence

"Those who look only at global temperature trends are like investigators using only eyewitness reports and ignoring fingerprints, video surveillance cameras, social media, and DNA-based evidence. Yet the contrarians continue to repeat their claims using outmoded techniques and data."

-- William Nordhaus, The Climate Casino: Risk, Uncertainty, and Economics for a Warming World
(Worth reading.)

Steyn's Silencing of Science

In the nth-latest response in the chain of countersuits to earlier lawsuits, Mark Steyn Inc's latest filing includes
Steyn's counterclaims are simple and straightforward, vindicate important public interests, and have a common thread. All grow out of plaintiff's use of this lawsuit and others to silence criticism of plaintiff himself.
which is deliciously ironic, since Steyn has never offered an iota of thoughtful criticism against Mann's work except to endlessly yell fraud! -- for which he's never offered an iota of supporting evidence, either. Nor has he admitted that neither Mann nor any of his co-authors ever filed a lawsuit against anyone making a real criticism -- viz. a scientific criticism -- of their work.

Fraud, fraud, fraud!

Since Steyn doesn't understand the science, it seems the only way he knows to try to silence the debate. Just yell "fraud" loud enough, on enough right-wing forums, and maybe you'll convince the trogs there must be something there, since they don't understand the science either. That will teach climate scientists a lesson about daring to do science! Just go back to your ivy towers, eggheads, lest the mob silence you again with even worse accusations next time.

Steyn made money off his Islamaphobia. Maybe he can do the same with climatephobia. He seems to be giving it a good try.

Tuesday, April 01, 2014

Maybe CO2 is a Harmless Trace Gas

The HadCRUT4 anomaly for February is very low: +0.299°C relative to their baseline of 1961-1990.

That's the lowest February anomaly since the end of the Plantagenet dynasty  Mark Steyn was in knickers  the moon landing was faked 2012.

The 15-year change is +0.11°C, but the error bar reaches halfway to Jupiter and the confidence level is only 1099-99%. Anyway, the climate system is chaotic, it often goes in more than one direction at once, and it probably loops back on itself like a stadium wave coiled snake Cuisinart blender.

Let's face it: climate is one nasty mofo.

The hockey stick is looking more and more like a lacrosse stick. Or maybe a ping pong paddle. And I don't mean one of those nice padded Chinese paddles that lets you put all kind of clever spin on the ball, I mean a hard, pimpled American racket like you had in your basement, scuffed all around the edge with the handle held on by duct tape.

As Richard Feynman said, science is the belief we should ignore all the experts, and it may be time to give up on the CO2 charade and find another agent for worldwide control.

Perhaps velcro? (I doubt they'd fall for oxygen).